1. Climate App
The app
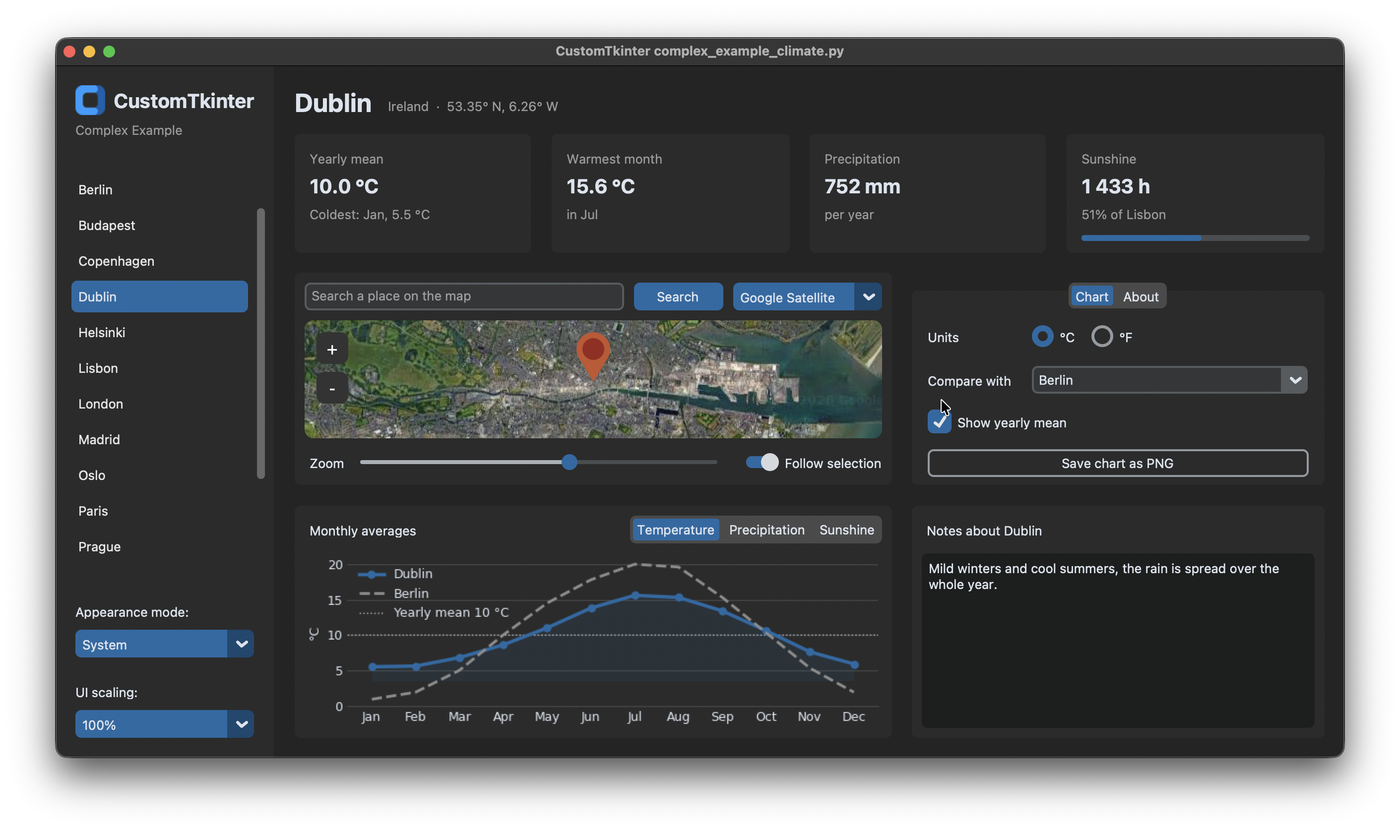
This app is the complex example of CustomTkinter, complex_example_climate.py in the examples folder. It shows the climate of 17 European capitals: a list of the cities on the left, the most important values at the top, a map with all cities, a chart with the monthly averages, options for the chart and notes for every city.
Most parts of it are explained on their own in the other tutorials. Here we see how they fit together in one app, how the layout is done and how all widgets are updated when another city is selected. The map and the chart need two more packages:
pip install matplotlib tkintermapview
The logo in the sidebar is CustomTkinter_logo_single.png from the examples folder. Put it in a folder assets next to your script.
The data
The climate values are stored in a dictionary at the top of the file, separate from the widgets. Every city has its country, its position for the map and twelve monthly values for temperature, precipitation and sunshine:
CITIES = {
    "Amsterdam": {"country": "Netherlands", "position": (52.370, 4.895),
                  "temperature": [3.9, 4.2, 6.6, 9.7, 13.3, 15.9, 18.0, 17.9, 15.2, 11.3, 7.5, 4.6],
                  "precipitation": [68, 56, 55, 39, 53, 66, 79, 87, 82, 84, 82, 76],
                  "sunshine": [63, 85, 141, 199, 233, 222, 225, 208, 155, 115, 64, 52]},
    ...
}
The app only reads from CITIES, so it works with any number of cities. If you add a city here and a text for it in NOTES, it appears in the list, on the map and in the compare box without changing anything else. In a real app the data would come from a file or a web API, but the rest of the code would stay the same.
Layout
The window has two columns: the sidebar in column 0 and the main view in column 1. Only column 1 has a weight, so the sidebar keeps its width and the main view gets all the space that is left when the window gets bigger:
self.grid_columnconfigure(1, weight=1)
self.grid_rowconfigure(0, weight=1)
self.create_sidebar()
self.create_main_view()
Each part of the window is created in its own method, which keeps __init__ short. The main view is a transparent frame with its own grid. The header with the city name and the value cards span both columns, below them the map and the chart are on the left and the tabview and the notes on the right:
main = customtkinter.CTkFrame(self, fg_color="transparent")
main.grid(row=0, column=1, padx=20, pady=20, sticky="nsew")
# uniform: the columns and rows keep their proportions, also when the content of the tabview changes
main.grid_columnconfigure(0, weight=3, uniform="columns")
main.grid_columnconfigure(1, weight=2, uniform="columns")
main.grid_rowconfigure((2, 3), weight=1, uniform="rows")
The weights alone only distribute the space that is left over. The columns would still get wider or narrower when the content changes, for example when you switch to the About tab, which has a long text. With uniform, all columns of the same group get their size only from the weight, so the left column is always 3/5 and the right column 2/5 of the width. Rows 2 and 3 are in a group too, so the map and the chart always have the same height. More about the grid is in Grid System.
Sidebar
The sidebar starts with the logo and the name of the app. The CTkImage is shown together with the text in one label, compound="left" puts the image to the left of the text. The same image file is used as window icon with iconphoto:
logo = customtkinter.CTkImage(Image.open(LOGO_PATH), size=(30, 30))
customtkinter.CTkLabel(sidebar, text="  CustomTkinter", image=logo, compound="left",
                       font=self.value_font).grid(row=0, column=0, padx=20, pady=(20, 0), sticky="w")
customtkinter.CTkLabel(sidebar, text="Complex Example", text_color=GRAY_TEXT_COLOR).grid(row=1, column=0, padx=20, sticky="w")
Below is the list of cities, a CTkScrollableFrame with a button for every city. The buttons are transparent with a gray hover color, so they look like a list and not like normal buttons:
city_list = customtkinter.CTkScrollableFrame(sidebar, width=160, fg_color="transparent")
city_list.grid(row=2, column=0, padx=(10, 5), pady=(15, 10), sticky="nsew")
city_list.grid_columnconfigure(0, weight=1)
self.city_buttons = {}
for row, name in enumerate(CITIES):
    button = customtkinter.CTkButton(city_list, text=name, anchor="w", height=32, fg_color="transparent",
                                     text_color=("gray10", "gray90"), hover_color=("gray75", "gray25"),
                                     command=lambda name=name: self.select_city(name))
    button.grid(row=row, column=0, padx=(0, 5), pady=2, sticky="ew")
    self.city_buttons[name] = button
lambda name=name: is needed, because a lambda in a loop would otherwise use the value of name from the last loop iteration, so every button would select Warsaw. The buttons are stored in a dictionary to highlight the selected one later. Row 2 of the sidebar has a weight, so the list gets all the height between the logo and the option menus for the appearance mode and the scaling at the bottom. More about the list is in Scrollable Frames.
Value cards
The four cards at the top all look the same: a gray title, a big value and a gray detail line. So they are created by one method, which returns the labels in a dictionary:
    def create_value_card(self, master, title, column):
        frame = customtkinter.CTkFrame(master)
        frame.grid(row=0, column=column, padx=(0, 20) if column < 3 else 0, sticky="nsew")
        frame.grid_columnconfigure(0, weight=1)
        customtkinter.CTkLabel(frame, text=title, text_color=GRAY_TEXT_COLOR).grid(row=0, column=0, padx=15, pady=(10, 0), sticky="w")
        value = customtkinter.CTkLabel(frame, font=self.value_font)
        value.grid(row=1, column=0, padx=15, sticky="w")
        detail = customtkinter.CTkLabel(frame, text_color=GRAY_TEXT_COLOR)
        detail.grid(row=2, column=0, padx=15, pady=(0, 8), sticky="w")
        return {"frame": frame, "value": value, "detail": detail}
The labels don't have a text yet, it's set when a city is selected. The sunshine card gets an additional CTkProgressBar in its frame, which shows the sunshine hours compared to the sunniest city. The fonts of the city name in the header and of the values are CTkFont objects, which are created once in __init__ and used by several widgets. See Fonts.
Select a city
A city can be selected in the list and on the map. Both call the same method select_city, and this is the only place where the app changes from one city to another:
    def select_city(self, name):
        if self.city is not None:
            self.notes[self.city] = self.notes_textbox.get("1.0", "end-1c")
            self.city_buttons[self.city].configure(fg_color="transparent", text_color=("gray10", "gray90"))
            self.markers[self.city].set_text(None)

        self.city = name
        self.city_buttons[name].configure(fg_color=ACCENT_COLOR, text_color=THEME["CTkButton"]["text_color"])
        self.markers[name].set_text(name)
        self.notes_label.configure(text=f"Notes about {name}")
        self.notes_textbox.delete("1.0", "end")
        self.notes_textbox.insert("1.0", self.notes.get(name, NOTES[name]))
        if self.follow_switch.get():
            self.map.set_position(*CITIES[name]["position"])

        self.update_city_view()
First the old city is cleaned up: its notes are saved, its button gets transparent again and its marker loses its name. Then the new city gets the color of the normal buttons from the current theme, its marker shows the name and the notes of the new city are loaded. If you change the theme to "green", the selected city in the list is green as well.
update_city_view then sets the texts of the header and the value cards and draws the chart. It's a separate method, because it's also called when only the unit changes from °C to °F and the city stays the same:
        temperatures = self.temperatures(self.city)
        warmest = temperatures.index(max(temperatures))
        coldest = temperatures.index(min(temperatures))
        self.mean_card["value"].configure(text=f"{sum(temperatures) / 12:.1f} {self.unit.get()}")
        self.mean_card["detail"].configure(text=f"Coldest: {MONTHS[coldest]}, {temperatures[coldest]:.1f} {self.unit.get()}")
        self.warmest_card["value"].configure(text=f"{temperatures[warmest]:.1f} {self.unit.get()}")
        self.warmest_card["detail"].configure(text=f"in {MONTHS[warmest]}")
Because all widgets are updated in these two methods, they can never show values of different cities.
Map
The map is a TkinterMapView with rounded corners like the frames around it. Every city gets a marker. The name of the city is stored in the data of the marker, so the command of the marker knows which city was clicked:
self.map = tkintermapview.TkinterMapView(card, corner_radius=14)
self.map.grid(row=1, column=0, columnspan=3, padx=10, sticky="nsew")
self.map.set_position(50.5, 10.0)
self.map.set_zoom(4)
self.markers = {}
for name, city in CITIES.items():
    self.markers[name] = self.map.set_marker(*city["position"], data=name, command=lambda marker: self.select_city(marker.data))
The option menu above the map changes the tile server. The URLs and the maximum zoom of each server are stored in MAP_STYLES. On the dark satellite images, the dark red text of the markers can't be read, so it's changed to white:
    def change_map_style(self, style):
        url, max_zoom = MAP_STYLES[style]
        self.map.set_tile_server(url, max_zoom=max_zoom)
        for marker in self.markers.values():  # marker names have to be readable on the dark satellite images
            marker.text_color = "white" if style == "Google Satellite" else "#652A22"
            marker.draw()
The search entry uses set_address, which looks up the address and sets a marker there. It returns False if nothing was found, then the entry shows this as placeholder text. The <Return> binding starts the search also with the enter key.
The zoom slider below the map sets the zoom with its command. But the map can also be zoomed with the mouse wheel and the + and - buttons on the map, and TkinterMapView has no event for this. So the slider checks the zoom of the map every 250 milliseconds and follows it:
    def update_zoom_slider(self):
        """ the map can also be zoomed with the mouse wheel and its buttons, the slider follows it """
        if round(self.zoom_slider.get()) != round(self.map.zoom):
            self.zoom_slider.set(round(self.map.zoom))
        self.after(250, self.update_zoom_slider)
set on a slider doesn't call its command, so this doesn't zoom the map again. More about markers and tile servers is in the TkinterMapView tutorials.
Chart
The chart is a matplotlib Figure on a FigureCanvasTkAgg, placed in a frame like in Matplotlib in CustomTkinter. The segmented button above it chooses between temperature, precipitation and sunshine. Temperature is drawn as a line, precipitation and sunshine as bars.
Because the type of the chart changes, and the compare line and the mean line can be there or not, draw_chart doesn't change the existing lines. It clears the axes and draws everything again with chart.clear(). For twelve values this is fast enough, and the chart can't keep any old lines by mistake:
        chart = self.chart
        chart.clear()
        self.figure.set_facecolor(background)
        chart.set_facecolor(background)

        months = range(12)
        if quantity == "Temperature":
            chart.fill_between(months, values, min(values) - 2, color=accent, alpha=0.12, linewidth=0)
            plot = chart.plot(months, values, color=accent, linewidth=2.5, marker="o", markersize=5, label=self.city, zorder=3)[0]
        else:
            plot = chart.bar(months, values, width=0.6, color=accent, label=self.city, zorder=3)
The colors come from the theme, so the line has the same color as the selected city in the list. Matplotlib doesn't understand tkinter color names like "gray86" or the tuples of light and dark color that CustomTkinter uses, so the color method converts them to hex for the current appearance mode:
    def color(self, color):
        """ hex value of a CustomTkinter color for matplotlib, colors are names like "gray20" or tuples for light and dark mode """
        if isinstance(color, (tuple, list)):
            color = color[0] if customtkinter.get_appearance_mode() == "Light" else color[1]
        red, green, blue = (value // 257 for value in self.winfo_rgb(color))
        return f"#{red:02x}{green:02x}{blue:02x}"
When the appearance mode changes, also when the system changes it, the AppearanceModeTracker calls appearance_mode_changed, which draws the chart again with the new colors. The method is removed from the tracker again in destroy.
Chart and scaling
The widgets of CustomTkinter are scaled on HighDPI displays and when another UI scaling is chosen in the sidebar. Matplotlib doesn't know about this, so the text in the chart would stay small. The resolution of the figure, dpi, is set to 100 pixels per inch times the scaling of the widgets, so the chart gets bigger together with them:
    def update_chart_dpi(self):
        """ the chart has to be scaled like the widgets, for example on HighDPI displays or with set_widget_scaling() """
        dpi = 100 * customtkinter.ScalingTracker.get_widget_scaling(self)
        if self.figure.get_dpi() != dpi:
            self.figure.set_dpi(dpi)
            widget = self.chart_canvas.get_tk_widget()
            if widget.winfo_width() > 1:
                self.figure.set_size_inches(widget.winfo_width() / dpi, widget.winfo_height() / dpi)
                self.update_month_names(widget.winfo_width())
            self.chart_canvas.draw_idle()
The size of the figure is set in inches, so it has to be set again with the new dpi, otherwise the figure doesn't fit the widget anymore. change_scaling calls this method 50 milliseconds after set_widget_scaling, when the widgets have their new size.
When the window is small or the scaling is high, the month names don't fit below the chart and overlap. The canvas widget gets a <Configure> binding, which is called every time its size changes. If there are less than 0.3 inches per month, the chart is drawn with only the first letter of the month names. add="+" keeps the binding of matplotlib, which resizes the figure.
Options and notes
The tabview next to the chart has the options for the chart in the Chart tab. The two radio buttons for °C and °F share one StringVar, so only one of them can be selected. The combobox chooses a city to compare with. With state="readonly" you can only choose from the list and not type a name that doesn't exist:
self.compare_box = customtkinter.CTkComboBox(chart_tab, values=["Nothing"] + list(CITIES), state="readonly",
                                             command=lambda value: self.draw_chart())
The button to save the chart is transparent with a border, so it doesn't look as important as the normal buttons. It opens a file dialog and saves the figure with savefig. See Tabview and Dropdowns for these widgets.
The notes are a CTkTextbox with wrap="word", which breaks the lines between words. Every city starts with a short text from NOTES. What you write is saved in self.notes by select_city before the next city is loaded, so the notes stay when you switch back. They are not saved in a file, so they are gone after closing the app. How to read and write files with a textbox is in Textbox.
Full code
"""
Complex example: climate overview of European capitals, with a map (TkinterMapView) and a chart (matplotlib).

This example needs two more packages:

    pip install matplotlib tkintermapview
"""

import os
import tkinter
import customtkinter

try:
    from PIL import Image
    import tkintermapview
    from matplotlib.figure import Figure
    from matplotlib.backends.backend_tkagg import FigureCanvasTkAgg
except ImportError as error:
    raise SystemExit(f"{error.name} is missing, install the packages for this example with: pip install matplotlib tkintermapview")

customtkinter.set_appearance_mode("system")  # Modes: "system" (standard), "dark", "light"
customtkinter.set_default_color_theme("blue")  # Themes: "blue" (standard), "green", "dark-blue"

MONTHS = ["Jan", "Feb", "Mar", "Apr", "May", "Jun", "Jul", "Aug", "Sep", "Oct", "Nov", "Dec"]

# approximate monthly averages of 1991-2020: temperature in °C, precipitation in mm, sunshine in hours
CITIES = {
    "Amsterdam": {"country": "Netherlands", "position": (52.370, 4.895),
                  "temperature": [3.9, 4.2, 6.6, 9.7, 13.3, 15.9, 18.0, 17.9, 15.2, 11.3, 7.5, 4.6],
                  "precipitation": [68, 56, 55, 39, 53, 66, 79, 87, 82, 84, 82, 76],
                  "sunshine": [63, 85, 141, 199, 233, 222, 225, 208, 155, 115, 64, 52]},
    "Athens": {"country": "Greece", "position": (37.984, 23.728),
               "temperature": [9.9, 10.6, 12.8, 16.3, 21.0, 25.9, 28.6, 28.6, 24.6, 19.9, 15.4, 11.5],
               "precipitation": [51, 44, 43, 27, 17, 9, 6, 5, 18, 39, 64, 70],
               "sunshine": [130, 134, 183, 231, 291, 336, 363, 343, 270, 210, 155, 120]},
    "Berlin": {"country": "Germany", "position": (52.520, 13.405),
               "temperature": [0.9, 1.9, 5.0, 10.0, 14.5, 17.8, 20.0, 19.6, 15.3, 10.3, 5.3, 1.9],
               "precipitation": [42, 36, 37, 30, 55, 60, 59, 63, 47, 37, 43, 47],
               "sunshine": [51, 76, 127, 207, 245, 245, 249, 230, 172, 116, 56, 40]},
    "Budapest": {"country": "Hungary", "position": (47.498, 19.040),
                 "temperature": [0.6, 2.6, 7.1, 12.6, 17.2, 20.9, 23.0, 22.8, 17.6, 12.0, 6.4, 1.6],
                 "precipitation": [37, 34, 32, 40, 64, 68, 56, 59, 50, 39, 52, 43],
                 "sunshine": [64, 96, 148, 197, 245, 262, 290, 274, 202, 156, 79, 54]},
    "Copenhagen": {"country": "Denmark", "position": (55.676, 12.568),
                   "temperature": [1.4, 1.3, 3.3, 7.3, 11.6, 15.1, 17.6, 17.5, 14.1, 9.9, 5.8, 2.9],
                   "precipitation": [46, 31, 35, 31, 46, 63, 63, 72, 61, 60, 56, 54],
                   "sunshine": [44, 66, 130, 199, 255, 248, 244, 214, 156, 102, 53, 35]},
    "Dublin": {"country": "Ireland", "position": (53.350, -6.260),
               "temperature": [5.5, 5.6, 6.8, 8.6, 11.0, 13.8, 15.6, 15.3, 13.4, 10.6, 7.6, 5.9],
               "precipitation": [63, 48, 51, 50, 56, 63, 63, 73, 59, 76, 76, 74],
               "sunshine": [59, 75, 109, 160, 195, 174, 158, 154, 128, 97, 71, 53]},
    "Helsinki": {"country": "Finland", "position": (60.170, 24.938),
                 "temperature": [-3.6, -4.4, -1.1, 4.2, 10.3, 14.8, 17.9, 16.5, 11.7, 6.4, 2.0, -1.4],
                 "precipitation": [52, 38, 36, 32, 37, 59, 69, 80, 59, 77, 73, 61],
                 "sunshine": [33, 64, 136, 206, 283, 290, 302, 232, 152, 84, 33, 21]},
    "Lisbon": {"country": "Portugal", "position": (38.722, -9.139),
               "temperature": [11.6, 12.6, 14.9, 16.2, 18.6, 21.6, 23.5, 23.9, 22.4, 19.3, 15.1, 12.4],
               "precipitation": [100, 81, 60, 63, 46, 13, 4, 6, 33, 88, 108, 117],
               "sunshine": [142, 156, 202, 238, 292, 313, 351, 341, 268, 207, 152, 141]},
    "London": {"country": "United Kingdom", "position": (51.507, -0.128),
               "temperature": [5.8, 6.2, 8.1, 10.6, 13.9, 17.1, 19.3, 18.9, 16.2, 12.6, 8.9, 6.3],
               "precipitation": [56, 41, 37, 42, 47, 47, 47, 53, 49, 66, 60, 56],
               "sunshine": [61, 78, 115, 168, 199, 204, 212, 199, 151, 112, 70, 52]},
    "Madrid": {"country": "Spain", "position": (40.417, -3.704),
               "temperature": [6.6, 8.1, 11.2, 13.6, 17.5, 23.0, 26.2, 25.8, 21.4, 15.8, 10.3, 7.1],
               "precipitation": [32, 35, 34, 47, 48, 21, 11, 10, 25, 67, 57, 47],
               "sunshine": [149, 158, 211, 230, 286, 333, 362, 337, 250, 194, 155, 128]},
    "Oslo": {"country": "Norway", "position": (59.914, 10.752),
             "temperature": [-2.3, -2.1, 0.9, 5.6, 10.8, 14.8, 17.3, 16.1, 11.7, 6.4, 2.0, -1.6],
             "precipitation": [54, 42, 41, 44, 59, 75, 83, 98, 82, 95, 84, 54],
             "sunshine": [41, 79, 143, 190, 247, 255, 254, 207, 141, 87, 49, 33]},
    "Paris": {"country": "France", "position": (48.857, 2.352),
              "temperature": [5.4, 6.2, 9.0, 11.8, 15.2, 18.6, 20.9, 20.6, 17.2, 13.3, 8.8, 5.9],
              "precipitation": [51, 41, 42, 45, 66, 50, 62, 57, 48, 56, 56, 58],
              "sunshine": [59, 84, 136, 179, 199, 222, 231, 218, 172, 120, 69, 52]},
    "Prague": {"country": "Czechia", "position": (50.076, 14.438),
               "temperature": [-0.5, 0.8, 4.3, 9.3, 14.0, 17.4, 19.4, 19.0, 14.4, 9.2, 4.2, 0.6],
               "precipitation": [24, 23, 28, 28, 61, 70, 73, 64, 41, 30, 30, 27],
               "sunshine": [52, 77, 131, 191, 231, 237, 252, 238, 172, 115, 54, 41]},
    "Rome": {"country": "Italy", "position": (41.903, 12.496),
             "temperature": [7.9, 8.7, 11.2, 14.0, 18.2, 22.4, 25.2, 25.4, 21.6, 17.5, 12.6, 9.0],
             "precipitation": [67, 73, 58, 81, 53, 34, 19, 33, 68, 113, 111, 91],
             "sunshine": [121, 132, 167, 201, 264, 285, 332, 298, 237, 195, 129, 112]},
    "Stockholm": {"country": "Sweden", "position": (59.329, 18.069),
                  "temperature": [-0.7, -1.2, 1.6, 6.3, 11.4, 15.7, 18.4, 17.4, 12.9, 7.6, 3.6, 0.6],
                  "precipitation": [40, 30, 27, 30, 36, 59, 61, 72, 51, 52, 49, 45],
                  "sunshine": [40, 74, 155, 218, 293, 286, 295, 239, 165, 101, 51, 30]},
    "Vienna": {"country": "Austria", "position": (48.208, 16.374),
               "temperature": [0.9, 2.5, 6.6, 11.6, 16.2, 19.8, 21.9, 21.4, 16.6, 11.1, 5.8, 1.7],
               "precipitation": [39, 44, 51, 46, 72, 70, 69, 72, 64, 40, 49, 45],
               "sunshine": [63, 94, 141, 203, 248, 261, 285, 270, 192, 136, 69, 51]},
    "Warsaw": {"country": "Poland", "position": (52.230, 21.012),
               "temperature": [-1.5, -0.5, 3.0, 9.0, 14.3, 17.6, 19.6, 18.9, 13.9, 8.6, 3.9, 0.0],
               "precipitation": [33, 29, 34, 33, 60, 66, 77, 62, 51, 37, 36, 35],
               "sunshine": [43, 64, 121, 189, 253, 250, 259, 247, 172, 112, 44, 30]},
}

NOTES = {
    "Amsterdam": "Mild and wet all year, a light rain jacket is never wrong. Cycling along the canals is best from May to September.",
    "Athens": "Very hot and dry in July and August. Spring and autumn are much better for walking up to the Acropolis.",
    "Berlin": "Warm summers and grey winters. Swimming in the lakes from June to August, Christmas markets in December.",
    "Budapest": "Hot summers and cold winters. The thermal baths are worth a visit in every season.",
    "Copenhagen": "Windy and cool most of the year. Long summer evenings, but very short days in December.",
    "Dublin": "Mild winters and cool summers, the rain is spread over the whole year.",
    "Helsinki": "The coldest capital in this list. Snow from December to March, white nights in June.",
    "Lisbon": "Warm and sunny, the winters are mild but rainy. The Atlantic is cold even in summer.",
    "London": "Mild and changeable weather, it rarely gets really hot or really cold.",
    "Madrid": "Hot and dry summers, cold nights in winter because of the altitude.",
    "Oslo": "Cold winters with snow and pleasant summers. August and October are the wettest months.",
    "Paris": "Mild climate with rain in every month. Spring and early autumn are the best time to visit.",
    "Prague": "Rather dry, most of the rain falls in summer thunderstorms. Cold winters.",
    "Rome": "Hot summers and mild winters, October and November are the wettest months.",
    "Stockholm": "Cold winters, but sunny summers with very long days.",
    "Vienna": "Warm summers and cold winters, often windy.",
    "Warsaw": "Continental climate with cold winters and warm summers.",
}

MAP_STYLES = {
    "Google Satellite": ("https://mt0.google.com/vt/lyrs=s&hl=en&x={x}&y={y}&z={z}&s=Ga", 22),
    "Google Maps": ("https://mt0.google.com/vt/lyrs=m&hl=en&x={x}&y={y}&z={z}&s=Ga", 22),
    "OpenStreetMap": ("https://tile.openstreetmap.org/{z}/{x}/{y}.png", 19),
}

LOGO_PATH = os.path.join(os.path.dirname(os.path.abspath(__file__)), "assets", "CustomTkinter_logo_single.png")

THEME = customtkinter.ThemeManager.theme
ACCENT_COLOR = THEME["CTkButton"]["fg_color"]  # (light, dark) color of the current theme
GRAY_TEXT_COLOR = ("gray40", "gray60")


class App(customtkinter.CTk):
    def __init__(self):
        super().__init__()

        self.title("CustomTkinter complex_example_climate.py")
        self.iconphoto(True, tkinter.PhotoImage(file=LOGO_PATH))  # window icon on Linux, Dock icon on macOS
        self.geometry("1240x780")
        self.minsize(1000, 660)

        # CTkFont objects can be changed later, all widgets that use them are updated
        self.title_font = customtkinter.CTkFont(size=26, weight="bold")
        self.value_font = customtkinter.CTkFont(size=20, weight="bold")

        self.city = None
        self.notes = {}

        self.grid_columnconfigure(1, weight=1)
        self.grid_rowconfigure(0, weight=1)
        self.create_sidebar()
        self.create_main_view()

        self.select_city("Berlin")
        # matplotlib doesn't know the appearance mode, the chart is drawn again when it changes, also when the system changes it
        customtkinter.AppearanceModeTracker.add(self.appearance_mode_changed)

    # ------------------------------------------------------------------ layout

    def create_sidebar(self):
        sidebar = customtkinter.CTkFrame(self, width=200, corner_radius=0)
        sidebar.grid(row=0, column=0, sticky="nsew")
        sidebar.grid_rowconfigure(2, weight=1)

        logo = customtkinter.CTkImage(Image.open(LOGO_PATH), size=(30, 30))
        customtkinter.CTkLabel(sidebar, text="  CustomTkinter", image=logo, compound="left",
                               font=self.value_font).grid(row=0, column=0, padx=20, pady=(20, 0), sticky="w")
        customtkinter.CTkLabel(sidebar, text="Complex Example", text_color=GRAY_TEXT_COLOR).grid(row=1, column=0, padx=20, sticky="w")

        city_list = customtkinter.CTkScrollableFrame(sidebar, width=160, fg_color="transparent")
        city_list.grid(row=2, column=0, padx=(10, 5), pady=(15, 10), sticky="nsew")
        city_list.grid_columnconfigure(0, weight=1)
        self.city_buttons = {}
        for row, name in enumerate(CITIES):
            button = customtkinter.CTkButton(city_list, text=name, anchor="w", height=32, fg_color="transparent",
                                             text_color=("gray10", "gray90"), hover_color=("gray75", "gray25"),
                                             command=lambda name=name: self.select_city(name))
            button.grid(row=row, column=0, padx=(0, 5), pady=2, sticky="ew")
            self.city_buttons[name] = button

        customtkinter.CTkLabel(sidebar, text="Appearance mode:", anchor="w").grid(row=3, column=0, padx=20, pady=(10, 0), sticky="w")
        appearance_menu = customtkinter.CTkOptionMenu(sidebar, values=["System", "Light", "Dark"], command=self.change_appearance_mode)
        appearance_menu.grid(row=4, column=0, padx=20, pady=(5, 10), sticky="ew")
        customtkinter.CTkLabel(sidebar, text="UI scaling:", anchor="w").grid(row=5, column=0, padx=20, pady=(10, 0), sticky="w")
        scaling_menu = customtkinter.CTkOptionMenu(sidebar, values=["80%", "90%", "100%", "110%", "120%"], command=self.change_scaling)
        scaling_menu.grid(row=6, column=0, padx=20, pady=(5, 20), sticky="ew")
        scaling_menu.set("100%")

    def create_main_view(self):
        main = customtkinter.CTkFrame(self, fg_color="transparent")
        main.grid(row=0, column=1, padx=20, pady=20, sticky="nsew")
        # uniform: the columns and rows keep their proportions, also when the content of the tabview changes
        main.grid_columnconfigure(0, weight=3, uniform="columns")
        main.grid_columnconfigure(1, weight=2, uniform="columns")
        main.grid_rowconfigure((2, 3), weight=1, uniform="rows")

        # header with the name of the selected city
        header = customtkinter.CTkFrame(main, fg_color="transparent")
        header.grid(row=0, column=0, columnspan=2, pady=(0, 15), sticky="ew")
        self.city_label = customtkinter.CTkLabel(header, font=self.title_font)
        self.city_label.grid(row=0, column=0, sticky="w")
        self.location_label = customtkinter.CTkLabel(header, text_color=GRAY_TEXT_COLOR)
        self.location_label.grid(row=0, column=1, padx=15, pady=(6, 0), sticky="w")

        self.create_value_cards(main)
        self.create_map(main)
        self.create_chart(main)
        self.create_options(main)
        self.create_notes(main)

    def create_value_cards(self, master):
        cards = customtkinter.CTkFrame(master, fg_color="transparent")
        cards.grid(row=1, column=0, columnspan=2, pady=(0, 20), sticky="ew")
        cards.grid_columnconfigure((0, 1, 2, 3), weight=1, uniform="cards")

        self.mean_card = self.create_value_card(cards, "Yearly mean", column=0)
        self.warmest_card = self.create_value_card(cards, "Warmest month", column=1)
        self.precipitation_card = self.create_value_card(cards, "Precipitation", column=2)
        self.sunshine_card = self.create_value_card(cards, "Sunshine", column=3)
        self.sunshine_bar = customtkinter.CTkProgressBar(self.sunshine_card["frame"], height=6)
        self.sunshine_bar.grid(row=3, column=0, padx=15, pady=(0, 12), sticky="ew")

    def create_value_card(self, master, title, column):
        frame = customtkinter.CTkFrame(master)
        frame.grid(row=0, column=column, padx=(0, 20) if column < 3 else 0, sticky="nsew")
        frame.grid_columnconfigure(0, weight=1)
        customtkinter.CTkLabel(frame, text=title, text_color=GRAY_TEXT_COLOR).grid(row=0, column=0, padx=15, pady=(10, 0), sticky="w")
        value = customtkinter.CTkLabel(frame, font=self.value_font)
        value.grid(row=1, column=0, padx=15, sticky="w")
        detail = customtkinter.CTkLabel(frame, text_color=GRAY_TEXT_COLOR)
        detail.grid(row=2, column=0, padx=15, pady=(0, 8), sticky="w")
        return {"frame": frame, "value": value, "detail": detail}

    def create_map(self, master):
        card = customtkinter.CTkFrame(master)
        card.grid(row=2, column=0, padx=(0, 20), pady=(0, 20), sticky="nsew")
        card.grid_columnconfigure(0, weight=1)
        card.grid_rowconfigure(1, weight=1)

        self.search_entry = customtkinter.CTkEntry(card, placeholder_text="Search a place on the map")
        self.search_entry.grid(row=0, column=0, padx=(10, 0), pady=10, sticky="ew")
        self.search_entry.bind("<Return>", lambda event: self.search_place())
        customtkinter.CTkButton(card, text="Search", width=90, command=self.search_place).grid(row=0, column=1, padx=10, pady=10)
        self.map_style_menu = customtkinter.CTkOptionMenu(card, values=list(MAP_STYLES), width=150, command=self.change_map_style)
        self.map_style_menu.grid(row=0, column=2, padx=(0, 10), pady=10)

        self.map = tkintermapview.TkinterMapView(card, corner_radius=14)
        self.map.grid(row=1, column=0, columnspan=3, padx=10, sticky="nsew")
        self.map.set_position(50.5, 10.0)
        self.map.set_zoom(4)
        self.markers = {}
        for name, city in CITIES.items():
            self.markers[name] = self.map.set_marker(*city["position"], data=name, command=lambda marker: self.select_city(marker.data))
        self.map_style_menu.set("Google Satellite")
        self.change_map_style("Google Satellite")

        controls = customtkinter.CTkFrame(card, fg_color="transparent")
        controls.grid(row=2, column=0, columnspan=3, padx=10, pady=10, sticky="ew")
        controls.grid_columnconfigure(1, weight=1)
        customtkinter.CTkLabel(controls, text="Zoom").grid(row=0, column=0, padx=(5, 10))
        self.zoom_slider = customtkinter.CTkSlider(controls, from_=2, to=19, number_of_steps=17,
                                                   command=lambda value: self.map.set_zoom(round(value)))
        self.zoom_slider.grid(row=0, column=1, sticky="ew")
        self.zoom_slider.set(4)
        self.after(250, self.update_zoom_slider)
        self.follow_switch = customtkinter.CTkSwitch(controls, text="Follow selection")
        self.follow_switch.grid(row=0, column=2, padx=(20, 0))
        self.follow_switch.select()

    def create_chart(self, master):
        self.chart_card = customtkinter.CTkFrame(master)
        self.chart_card.grid(row=3, column=0, padx=(0, 20), sticky="nsew")
        self.chart_card.grid_columnconfigure(0, weight=1)
        self.chart_card.grid_rowconfigure(1, weight=1)

        customtkinter.CTkLabel(self.chart_card, text="Monthly averages", anchor="w").grid(row=0, column=0, padx=15, pady=10, sticky="ew")
        self.quantity_button = customtkinter.CTkSegmentedButton(self.chart_card, values=["Temperature", "Precipitation", "Sunshine"],
                                                                command=lambda value: self.draw_chart())
        self.quantity_button.grid(row=0, column=1, padx=10, pady=10, sticky="e")
        self.quantity_button.set("Temperature")

        self.figure = Figure(figsize=(4, 2.4), layout="constrained")
        self.chart = self.figure.add_subplot()
        self.chart_canvas = FigureCanvasTkAgg(self.figure, master=self.chart_card)
        self.chart_canvas.get_tk_widget().configure(highlightthickness=0)
        self.chart_canvas.get_tk_widget().grid(row=1, column=0, columnspan=2, padx=10, pady=(0, 10), sticky="nsew")
        self.chart_canvas.get_tk_widget().bind("<Configure>", self.chart_resized, add="+")
        self.short_month_names = False
        self.update_chart_dpi()

    def create_options(self, master):
        tabview = customtkinter.CTkTabview(master, height=250)
        tabview.grid(row=2, column=1, pady=(0, 20), sticky="nsew")
        chart_tab = tabview.add("Chart")
        about_tab = tabview.add("About")

        chart_tab.grid_columnconfigure(1, weight=1)
        customtkinter.CTkLabel(chart_tab, text="Units").grid(row=0, column=0, padx=10, pady=8, sticky="w")
        self.unit = tkinter.StringVar(value="°C")
        unit_frame = customtkinter.CTkFrame(chart_tab, fg_color="transparent")
        unit_frame.grid(row=0, column=1, padx=10, sticky="w")
        for column, unit in enumerate(("°C", "°F")):
            customtkinter.CTkRadioButton(unit_frame, text=unit, value=unit, variable=self.unit, width=60,
                                         command=self.update_city_view).grid(row=0, column=column)

        customtkinter.CTkLabel(chart_tab, text="Compare with").grid(row=1, column=0, padx=10, pady=8, sticky="w")
        self.compare_box = customtkinter.CTkComboBox(chart_tab, values=["Nothing"] + list(CITIES), state="readonly",
                                                     command=lambda value: self.draw_chart())
        self.compare_box.grid(row=1, column=1, padx=10, sticky="ew")
        self.compare_box.set("Nothing")

        self.average_checkbox = customtkinter.CTkCheckBox(chart_tab, text="Show yearly mean", command=self.draw_chart)
        self.average_checkbox.grid(row=2, column=0, columnspan=2, padx=10, pady=8, sticky="w")
        self.average_checkbox.select()
        customtkinter.CTkButton(chart_tab, text="Save chart as PNG", fg_color="transparent", border_width=2,
                                text_color=("gray10", "#DCE4EE"), command=self.save_chart).grid(row=3, column=0, columnspan=2, padx=10, pady=8, sticky="ew")

        about_tab.grid_columnconfigure(0, weight=1)
        customtkinter.CTkLabel(about_tab, justify="left", anchor="w", wraplength=280,
                               text="The values are approximate monthly averages of the years 1991 to 2020. "
                                    "Click on a city in the list or on the map to see its climate.").grid(row=0, column=0, padx=10, pady=8, sticky="ew")

    def create_notes(self, master):
        card = customtkinter.CTkFrame(master)
        card.grid(row=3, column=1, sticky="nsew")
        card.grid_columnconfigure(0, weight=1)
        card.grid_rowconfigure(1, weight=1)
        self.notes_label = customtkinter.CTkLabel(card, anchor="w")
        self.notes_label.grid(row=0, column=0, padx=15, pady=10, sticky="ew")
        self.notes_textbox = customtkinter.CTkTextbox(card, wrap="word", height=100)
        self.notes_textbox.grid(row=1, column=0, padx=10, pady=(0, 10), sticky="nsew")

    # ------------------------------------------------------------------ city selection

    def select_city(self, name):
        if self.city is not None:
            self.notes[self.city] = self.notes_textbox.get("1.0", "end-1c")
            self.city_buttons[self.city].configure(fg_color="transparent", text_color=("gray10", "gray90"))
            self.markers[self.city].set_text(None)

        self.city = name
        self.city_buttons[name].configure(fg_color=ACCENT_COLOR, text_color=THEME["CTkButton"]["text_color"])
        self.markers[name].set_text(name)
        self.notes_label.configure(text=f"Notes about {name}")
        self.notes_textbox.delete("1.0", "end")
        self.notes_textbox.insert("1.0", self.notes.get(name, NOTES[name]))
        if self.follow_switch.get():
            self.map.set_position(*CITIES[name]["position"])

        self.update_city_view()

    def update_city_view(self):
        city = CITIES[self.city]
        latitude, longitude = city["position"]
        self.city_label.configure(text=self.city)
        self.location_label.configure(text=f"{city['country']}  ·  {latitude:.2f}° N, {abs(longitude):.2f}° {'E' if longitude >= 0 else 'W'}")

        temperatures = self.temperatures(self.city)
        warmest = temperatures.index(max(temperatures))
        coldest = temperatures.index(min(temperatures))
        self.mean_card["value"].configure(text=f"{sum(temperatures) / 12:.1f} {self.unit.get()}")
        self.mean_card["detail"].configure(text=f"Coldest: {MONTHS[coldest]}, {temperatures[coldest]:.1f} {self.unit.get()}")
        self.warmest_card["value"].configure(text=f"{temperatures[warmest]:.1f} {self.unit.get()}")
        self.warmest_card["detail"].configure(text=f"in {MONTHS[warmest]}")
        self.precipitation_card["value"].configure(text=f"{sum(city['precipitation'])} mm")
        self.precipitation_card["detail"].configure(text="per year")

        sunniest = max(CITIES, key=lambda name: sum(CITIES[name]["sunshine"]))
        sunshine = sum(city["sunshine"])
        self.sunshine_card["value"].configure(text=f"{sunshine:,} h".replace(",", " "))
        self.sunshine_card["detail"].configure(text="per year" if self.city == sunniest else f"{sunshine / sum(CITIES[sunniest]['sunshine']):.0%} of {sunniest}")
        self.sunshine_bar.set(sunshine / sum(CITIES[sunniest]["sunshine"]))

        self.draw_chart()

    def temperatures(self, name):
        if self.unit.get() == "°F":
            return [value * 9 / 5 + 32 for value in CITIES[name]["temperature"]]
        return CITIES[name]["temperature"]

    # ------------------------------------------------------------------ chart

    def color(self, color):
        """ hex value of a CustomTkinter color for matplotlib, colors are names like "gray20" or tuples for light and dark mode """
        if isinstance(color, (tuple, list)):
            color = color[0] if customtkinter.get_appearance_mode() == "Light" else color[1]
        red, green, blue = (value // 257 for value in self.winfo_rgb(color))
        return f"#{red:02x}{green:02x}{blue:02x}"

    def draw_chart(self):
        quantity = self.quantity_button.get()
        if quantity == "Temperature":
            values, unit = self.temperatures(self.city), self.unit.get()
        elif quantity == "Precipitation":
            values, unit = CITIES[self.city]["precipitation"], "mm"
        else:
            values, unit = CITIES[self.city]["sunshine"], "h"

        background = self.color(self.chart_card.cget("fg_color"))
        text_color = self.color(THEME["CTkLabel"]["text_color"])
        grid_color = self.color(("gray78", "gray28"))
        accent = self.color(ACCENT_COLOR)
        compare_color = self.color(("gray55", "gray55"))

        chart = self.chart
        chart.clear()
        self.figure.set_facecolor(background)
        chart.set_facecolor(background)

        months = range(12)
        if quantity == "Temperature":
            chart.fill_between(months, values, min(values) - 2, color=accent, alpha=0.12, linewidth=0)
            plot = chart.plot(months, values, color=accent, linewidth=2.5, marker="o", markersize=5, label=self.city, zorder=3)[0]
        else:
            plot = chart.bar(months, values, width=0.6, color=accent, label=self.city, zorder=3)

        handles = [plot]
        compare = self.compare_box.get()
        if compare in CITIES and compare != self.city:
            if quantity == "Temperature":
                compare_values = self.temperatures(compare)
            else:
                compare_values = CITIES[compare][quantity.lower()]
            handles += chart.plot(months, compare_values, color=compare_color, linewidth=2, linestyle="--", label=compare, zorder=4)

        if self.average_checkbox.get():
            mean = sum(values) / 12
            handles.append(chart.axhline(mean, color=text_color, linewidth=1, linestyle=":", alpha=0.7, zorder=2,
                                         label=f"Yearly mean {mean:.0f} {unit}"))

        if len(handles) > 1:
            chart.legend(handles=handles, frameon=False, labelcolor=text_color, fontsize=9, loc="best")

        chart.set_xticks(months, [month[0] for month in MONTHS] if self.short_month_names else MONTHS)
        chart.tick_params(colors=text_color, labelsize=9, length=0)
        chart.set_ylabel(unit, color=text_color, fontsize=9)
        chart.grid(axis="y", color=grid_color, linewidth=0.8)
        chart.set_axisbelow(True)
        for side, spine in chart.spines.items():
            spine.set_visible(side == "bottom")
            spine.set_color(grid_color)

        self.chart_canvas.get_tk_widget().configure(bg=background)  # can be visible for a moment when the window is resized
        self.chart_canvas.draw_idle()

    def appearance_mode_changed(self, mode):
        self.draw_chart()

    def chart_resized(self, event):
        self.update_month_names(event.width)

    def update_month_names(self, chart_width):
        """ the month names are shortened to one letter if there is not enough space for them """
        short_month_names = chart_width / 12 < 3 * self.figure.get_dpi() / 10
        if short_month_names != self.short_month_names and self.city is not None:
            self.short_month_names = short_month_names
            self.draw_chart()

    def update_chart_dpi(self):
        """ the chart has to be scaled like the widgets, for example on HighDPI displays or with set_widget_scaling() """
        dpi = 100 * customtkinter.ScalingTracker.get_widget_scaling(self)
        if self.figure.get_dpi() != dpi:
            self.figure.set_dpi(dpi)
            widget = self.chart_canvas.get_tk_widget()
            if widget.winfo_width() > 1:
                self.figure.set_size_inches(widget.winfo_width() / dpi, widget.winfo_height() / dpi)
                self.update_month_names(widget.winfo_width())
            self.chart_canvas.draw_idle()

    def save_chart(self):
        path = customtkinter.filedialog.asksaveasfilename(defaultextension=".png", initialfile=f"{self.city} {self.quantity_button.get()}.png",
                                                          filetypes=[("PNG image", "*.png")])
        if path:
            self.figure.savefig(path, dpi=200)

    # ------------------------------------------------------------------ map

    def search_place(self):
        address = self.search_entry.get().strip()
        if address:
            marker = self.map.set_address(address, marker=True, text=address)
            if marker is False:
                self.search_entry.delete(0, "end")
                self.search_entry.configure(placeholder_text=f"Nothing found for '{address}'")
                self.focus()  # shows the placeholder text again

    def change_map_style(self, style):
        url, max_zoom = MAP_STYLES[style]
        self.map.set_tile_server(url, max_zoom=max_zoom)
        for marker in self.markers.values():  # marker names have to be readable on the dark satellite images
            marker.text_color = "white" if style == "Google Satellite" else "#652A22"
            marker.draw()

    def update_zoom_slider(self):
        """ the map can also be zoomed with the mouse wheel and its buttons, the slider follows it """
        if round(self.zoom_slider.get()) != round(self.map.zoom):
            self.zoom_slider.set(round(self.map.zoom))
        self.after(250, self.update_zoom_slider)

    # ------------------------------------------------------------------ appearance mode and scaling

    def change_appearance_mode(self, mode):
        customtkinter.set_appearance_mode(mode)

    def change_scaling(self, scaling):
        customtkinter.set_widget_scaling(int(scaling.replace("%", "")) / 100)
        self.after(50, self.update_chart_dpi)

    def destroy(self):
        customtkinter.AppearanceModeTracker.remove(self.appearance_mode_changed)
        super().destroy()


if __name__ == "__main__":
    app = App()
    app.mainloop()
Common errors
matplotlib is missing, install the packages for this example with: pip install matplotlib tkintermapview
The imports of matplotlib and tkintermapview are in a try block. If one of them is not installed, the app ends with this message instead of a long traceback. Install both with pip install matplotlib tkintermapview for the Python you use to start the app.
FileNotFoundError: No such file or directory: '.../assets/CustomTkinter_logo_single.png'
The logo is not in the folder assets next to the script. The path is built from the location of the script with os.path.abspath(__file__), so it doesn't matter from which directory you start the app, but the folder has to be next to the file.
The map stays gray
The map loads its images from the tile server over the internet, so without a connection only the markers are visible. If only one map style doesn't work, the tile server may have blocked the requests, try another style in the option menu.
The text in the chart is too small on Windows or at 120% scaling
The figure was created without changing its dpi to the scaling of the widgets. Call update_chart_dpi at the start and after every change of the scaling like above.
The chart keeps the old colors after changing the appearance mode
Matplotlib doesn't know the appearance mode. The chart has to be drawn again with new colors, which is done by the AppearanceModeTracker calling appearance_mode_changed. If you change the colors of the frame around the chart, also change them in draw_chart, which takes the background color from self.chart_card.