1. Matplotlib in CustomTkinter
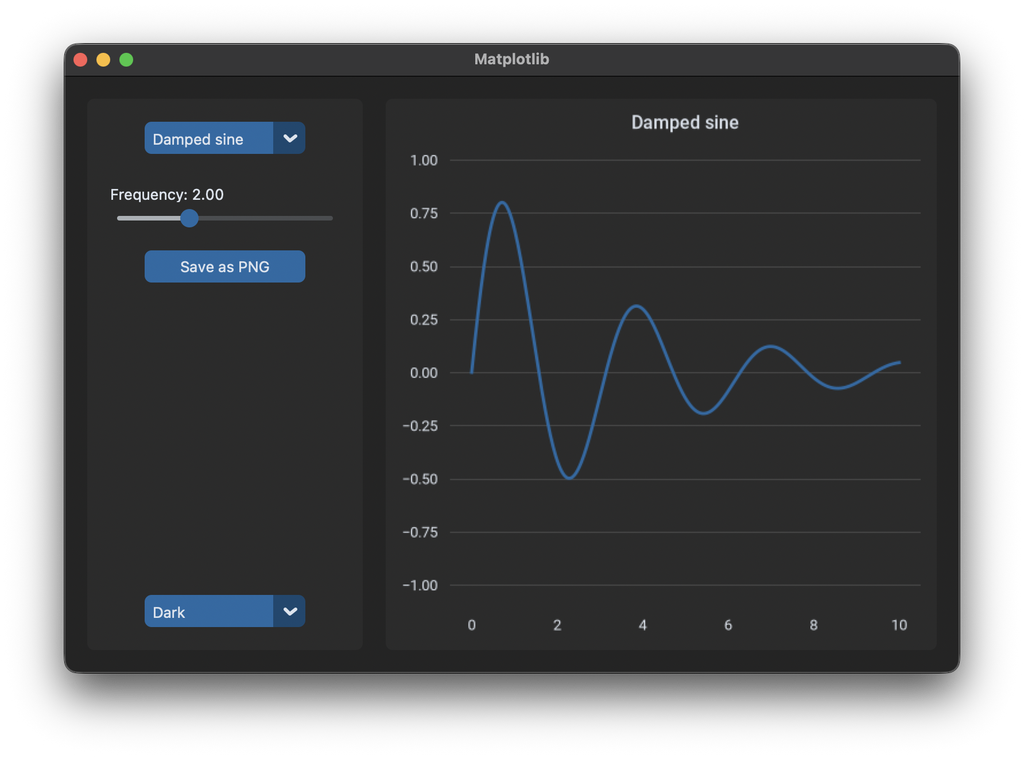
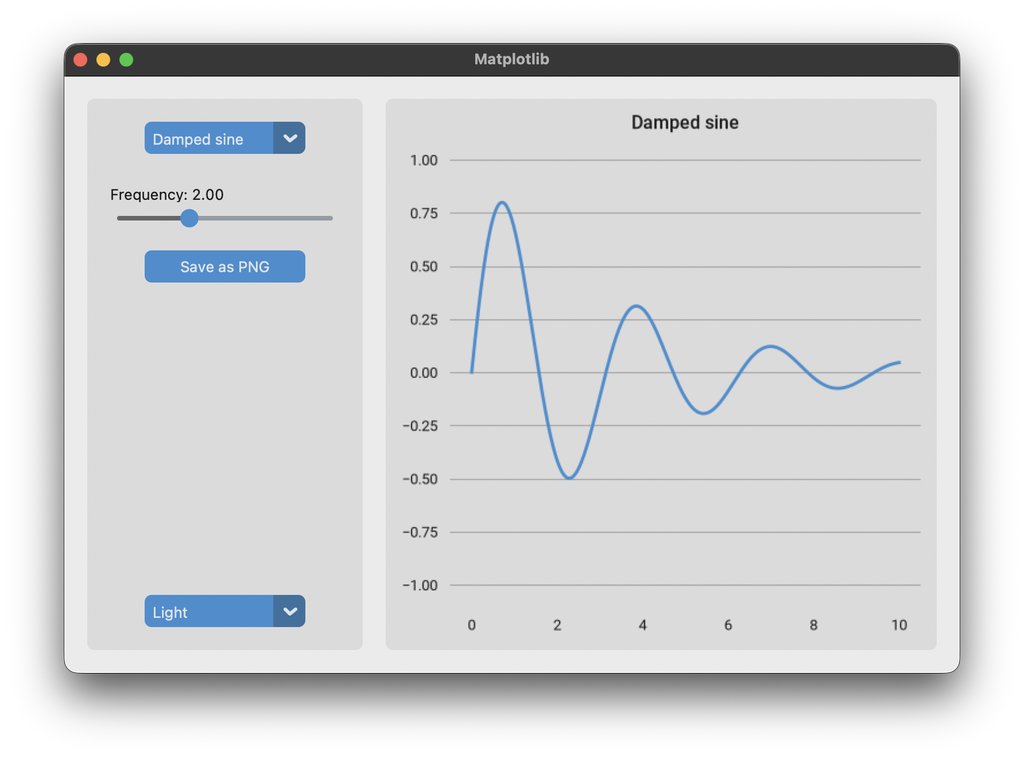
Matplotlib
Matplotlib is the most used library for charts in Python. It can draw into a tkinter widget, so a chart can be placed in a CustomTkinter window like any other widget. Matplotlib is installed with pip:
pip install matplotlib
The examples also use numpy, which is installed together with matplotlib.
By default a matplotlib chart is white with black text and a black frame around the plot, which doesn't fit into a CustomTkinter app, especially in dark mode. In this tutorial we embed a chart and give it the colors and the font of CustomTkinter, so it looks like a part of the app in light and dark mode.
Figure and canvas
A chart in matplotlib is a Figure, which contains one or more axes. The axes are the actual plot with the lines and the coordinate system. To show the figure in the window, it's put on a FigureCanvasTkAgg. The canvas creates a tkinter widget, which we get with get_tk_widget() and place with grid like any other widget:
from matplotlib.figure import Figure
from matplotlib.backends.backend_tkagg import FigureCanvasTkAgg

self.figure = Figure(figsize=(5, 4), dpi=100, layout="constrained")
self.ax = self.figure.add_subplot()
self.x = np.linspace(0, 10, 500)
self.line, = self.ax.plot(self.x, np.zeros_like(self.x), linewidth=2)

self.canvas = FigureCanvasTkAgg(self.figure, master=self.chart_frame)
self.canvas.get_tk_widget().grid(row=0, column=0, padx=10, pady=10, sticky="nsew")
Use matplotlib.figure.Figure here and not matplotlib.pyplot. pyplot manages its own windows, which doesn't work well together with a CustomTkinter app, see the common errors below.
figsize is the size in inches at the start. Because the row and column of the canvas have a weight and it's placed with sticky="nsew", the chart gets the size of the frame and changes its size together with the window. layout="constrained" makes sure that the title and the axis labels always fit into the figure. The padx and pady of the canvas keep the rounded corners of the frame visible.
plot returns a list of lines, the comma after self.line takes the first line out of this list. We keep it to change its data and its color later.
Update the chart
To change the chart, we don't create a new figure. We change the data of the existing line and tell the canvas to draw again:
    def update_chart(self):
        name = self.function_menu.get()
        frequency = self.frequency_slider.get()
        self.frequency_label.configure(text=f"Frequency: {frequency:.2f}")

        self.line.set_ydata(FUNCTIONS[name](self.x, frequency))
        self.ax.set_title(name)
        self.canvas.draw_idle()
Without draw_idle() the chart doesn't change on the screen. It doesn't draw immediately, but the next time the app has nothing else to do. So when the slider calls update_chart many times while it's moved, the chart is still only drawn as often as needed.
The option menu and the slider both call update_chart as their command. They pass their new value to the command, which we don't need, because update_chart reads all values from the widgets itself:
self.function_menu = customtkinter.CTkOptionMenu(self.side_frame, values=list(FUNCTIONS),
                                                 command=lambda value: self.update_chart())
Colors from the theme
Matplotlib doesn't know about the appearance mode of CustomTkinter, so we set the colors of the chart ourselves. To make it fit to the other widgets, we take the colors from the current CustomTkinter theme. ThemeManager.theme contains the colors of all widgets. Each color is a list with the light mode color at index 0 and the dark mode color at index 1.
Some of these colors are tkinter color names like "gray86", which matplotlib doesn't understand. winfo_rgb returns the red, green and blue values for every color tkinter knows, from 0 to 65535, which we convert into a hex color:
    def to_hex(self, color):
        # matplotlib doesn't know tkinter color names like "gray86", so we convert them to hex
        red, green, blue = self.winfo_rgb(color)
        return f"#{red // 256:02x}{green // 256:02x}{blue // 256:02x}"
The figure has two backgrounds: the face color of the figure is the area around the plot, the face color of the axes is the area inside. Both get the color of the frame the chart is placed in. The line gets the color of the buttons, the text the color of the labels and the grid lines the border color of the frame:
    def apply_chart_colors(self, mode=None):
        # colors of the current theme, index 0 is light mode, 1 is dark mode
        theme = customtkinter.ThemeManager.theme
        i = 0 if customtkinter.get_appearance_mode() == "Light" else 1
        background = self.to_hex(theme["CTkFrame"]["fg_color"][i])
        text_color = self.to_hex(theme["CTkLabel"]["text_color"][i])
        line_color = self.to_hex(theme["CTkButton"]["fg_color"][i])
        grid_color = self.to_hex(theme["CTkFrame"]["border_color"][i])

        self.figure.set_facecolor(background)
        self.ax.set_facecolor(background)
        self.line.set_color(line_color)
        self.ax.title.set_color(text_color)
        self.ax.tick_params(colors=text_color)
        self.ax.grid(True, axis="y", color=grid_color, linewidth=0.8)  # only horizontal lines

        self.canvas.get_tk_widget().configure(bg=background)
        self.canvas.draw_idle()
tick_params(colors=...) sets the color of the numbers on the axes. If your chart has axis labels or a legend, set their colors here too, for example with self.ax.xaxis.label.set_color(text_color). The background of the tkinter canvas widget is set as well, because it can be visible for a moment when the window is resized. If you use another theme, like "green", the chart automatically gets the colors of this theme.
The AppearanceModeTracker calls apply_chart_colors every time the appearance mode changes, also when the system changes from light to dark. It passes the new mode as argument, which is why the method has the mode parameter. We call it once at the start and remove it from the tracker again when the window is destroyed:
self.apply_chart_colors()
customtkinter.AppearanceModeTracker.add(self.apply_chart_colors)

def destroy(self):
    customtkinter.AppearanceModeTracker.remove(self.apply_chart_colors)
    super().destroy()
The same is explained for other tkinter widgets in Dark Mode.
Font and flat look
CustomTkinter comes with the font Roboto, which matplotlib can use too. We load the font files from the CustomTkinter folder and set Roboto as font for all charts in the app. This is done once at the start, before the figure is created:
# the chart uses the font that comes with CustomTkinter
FONT_FOLDER = os.path.join(os.path.dirname(customtkinter.__file__), "assets", "fonts", "Roboto")
font_manager.fontManager.addfont(os.path.join(FONT_FOLDER, "Roboto-Regular.ttf"))
font_manager.fontManager.addfont(os.path.join(FONT_FOLDER, "Roboto-Medium.ttf"))
matplotlib.rcParams["font.family"] = "Roboto"
matplotlib.rcParams["font.size"] = 13 * 72 / 100  # 13 pixels like the widgets, matplotlib uses points (1/72 inch)
matplotlib.rcParams["axes.titleweight"] = "medium"
The widgets use a font size of 13 pixels. Matplotlib measures font sizes in points, which are 1/72 inch, and the figure has 100 pixels per inch (dpi=100), so 13 pixels are 13 * 72 / 100 points. On macOS the widgets use the system font, which matplotlib can't load, but Roboto is close enough that the chart still fits.
The widgets of CustomTkinter are flat, without lines around them. So we also remove the frame around the plot, the spines, and the small tick marks next to the numbers. Only the horizontal grid lines stay, which are set in apply_chart_colors:
# flat look like the widgets: no frame around the plot and no tick marks, only grid lines
for spine in self.ax.spines.values():
    spine.set_visible(False)
self.ax.tick_params(length=0, pad=8)
Save the chart
savefig saves the figure as an image file. With a file dialog, the user can choose where:
    def save_chart(self):
        path = customtkinter.filedialog.asksaveasfilename(parent=self, defaultextension=".png",
                                                          filetypes=[("PNG image", "*.png")])
        if path:
            self.figure.savefig(path, dpi=200)
dpi sets the resolution of the saved image, independent of the size on the screen. The image has the colors of the current appearance mode. Formats like .pdf or .svg work the same way, matplotlib chooses the format from the file extension. More about file dialogs is in Dialogs.
Full code
import os
import numpy as np
import customtkinter
import matplotlib
from matplotlib import font_manager
from matplotlib.figure import Figure
from matplotlib.backends.backend_tkagg import FigureCanvasTkAgg

customtkinter.set_appearance_mode("system")

# the chart uses the font that comes with CustomTkinter
FONT_FOLDER = os.path.join(os.path.dirname(customtkinter.__file__), "assets", "fonts", "Roboto")
font_manager.fontManager.addfont(os.path.join(FONT_FOLDER, "Roboto-Regular.ttf"))
font_manager.fontManager.addfont(os.path.join(FONT_FOLDER, "Roboto-Medium.ttf"))
matplotlib.rcParams["font.family"] = "Roboto"
matplotlib.rcParams["font.size"] = 13 * 72 / 100  # 13 pixels like the widgets, matplotlib uses points (1/72 inch)
matplotlib.rcParams["axes.titleweight"] = "medium"

FUNCTIONS = {
    "Sine": lambda x, f: np.sin(f * x),
    "Cosine": lambda x, f: np.cos(f * x),
    "Damped sine": lambda x, f: np.exp(-0.3 * x) * np.sin(f * x),
}


class App(customtkinter.CTk):
    def __init__(self):
        super().__init__()

        self.title("Matplotlib")
        self.geometry("780x520")
        self.grid_columnconfigure(1, weight=1)
        self.grid_rowconfigure(0, weight=1)

        # controls on the left
        self.side_frame = customtkinter.CTkFrame(self)
        self.side_frame.grid(row=0, column=0, padx=(20, 10), pady=20, sticky="ns")
        self.side_frame.grid_rowconfigure(4, weight=1)

        self.function_menu = customtkinter.CTkOptionMenu(self.side_frame, values=list(FUNCTIONS),
                                                         command=lambda value: self.update_chart())
        self.function_menu.grid(row=0, column=0, padx=20, pady=20)

        self.frequency_label = customtkinter.CTkLabel(self.side_frame, text="")
        self.frequency_label.grid(row=1, column=0, padx=20, pady=0, sticky="w")
        self.frequency_slider = customtkinter.CTkSlider(self.side_frame, from_=0.5, to=5, number_of_steps=18,
                                                        command=lambda value: self.update_chart())
        self.frequency_slider.grid(row=2, column=0, padx=20, pady=(0, 20))
        self.frequency_slider.set(1)

        self.save_button = customtkinter.CTkButton(self.side_frame, text="Save as PNG", command=self.save_chart)
        self.save_button.grid(row=3, column=0, padx=20, pady=0)

        self.mode_menu = customtkinter.CTkOptionMenu(self.side_frame, values=["System", "Light", "Dark"],
                                                     command=customtkinter.set_appearance_mode)
        self.mode_menu.grid(row=5, column=0, padx=20, pady=20)

        # the chart on the right
        self.chart_frame = customtkinter.CTkFrame(self)
        self.chart_frame.grid(row=0, column=1, padx=(10, 20), pady=20, sticky="nsew")
        self.chart_frame.grid_columnconfigure(0, weight=1)
        self.chart_frame.grid_rowconfigure(0, weight=1)

        self.figure = Figure(figsize=(5, 4), dpi=100, layout="constrained")
        self.ax = self.figure.add_subplot()
        self.x = np.linspace(0, 10, 500)
        self.line, = self.ax.plot(self.x, np.zeros_like(self.x), linewidth=2)
        self.ax.set_ylim(-1.1, 1.1)

        # flat look like the widgets: no frame around the plot and no tick marks, only grid lines
        for spine in self.ax.spines.values():
            spine.set_visible(False)
        self.ax.tick_params(length=0, pad=8)

        self.canvas = FigureCanvasTkAgg(self.figure, master=self.chart_frame)
        self.canvas.get_tk_widget().grid(row=0, column=0, padx=10, pady=10, sticky="nsew")

        self.apply_chart_colors()
        customtkinter.AppearanceModeTracker.add(self.apply_chart_colors)
        self.update_chart()

    def update_chart(self):
        name = self.function_menu.get()
        frequency = self.frequency_slider.get()
        self.frequency_label.configure(text=f"Frequency: {frequency:.2f}")

        self.line.set_ydata(FUNCTIONS[name](self.x, frequency))
        self.ax.set_title(name)
        self.canvas.draw_idle()

    def to_hex(self, color):
        # matplotlib doesn't know tkinter color names like "gray86", so we convert them to hex
        red, green, blue = self.winfo_rgb(color)
        return f"#{red // 256:02x}{green // 256:02x}{blue // 256:02x}"

    def apply_chart_colors(self, mode=None):
        # colors of the current theme, index 0 is light mode, 1 is dark mode
        theme = customtkinter.ThemeManager.theme
        i = 0 if customtkinter.get_appearance_mode() == "Light" else 1
        background = self.to_hex(theme["CTkFrame"]["fg_color"][i])
        text_color = self.to_hex(theme["CTkLabel"]["text_color"][i])
        line_color = self.to_hex(theme["CTkButton"]["fg_color"][i])
        grid_color = self.to_hex(theme["CTkFrame"]["border_color"][i])

        self.figure.set_facecolor(background)
        self.ax.set_facecolor(background)
        self.line.set_color(line_color)
        self.ax.title.set_color(text_color)
        self.ax.tick_params(colors=text_color)
        self.ax.grid(True, axis="y", color=grid_color, linewidth=0.8)  # only horizontal lines

        self.canvas.get_tk_widget().configure(bg=background)
        self.canvas.draw_idle()

    def save_chart(self):
        path = customtkinter.filedialog.asksaveasfilename(parent=self, defaultextension=".png",
                                                          filetypes=[("PNG image", "*.png")])
        if path:
            self.figure.savefig(path, dpi=200)

    def destroy(self):
        customtkinter.AppearanceModeTracker.remove(self.apply_chart_colors)
        super().destroy()


app = App()
app.mainloop()
Common errors
The program doesn't end after closing the window
The figure was created with matplotlib.pyplot, for example with fig, ax = plt.subplots(). pyplot creates a second, hidden tkinter window for every figure, and the mainloop() keeps running as long as this window exists. Create the figure with matplotlib.figure.Figure like above and don't call plt.show().
ValueError: Invalid RGBA argument: 'gray86'
A tkinter color name was passed to matplotlib. Convert it with to_hex like above, or use hex colors.
The chart doesn't change, or only when the window is resized
Changing the data, the title or the colors doesn't redraw the canvas. Call self.canvas.draw_idle() at the end of the update.
The axis labels are cut off
The figure has a fixed space around the axes by default. Create it with layout="constrained", then the space is calculated from the labels.