3. Live Charts
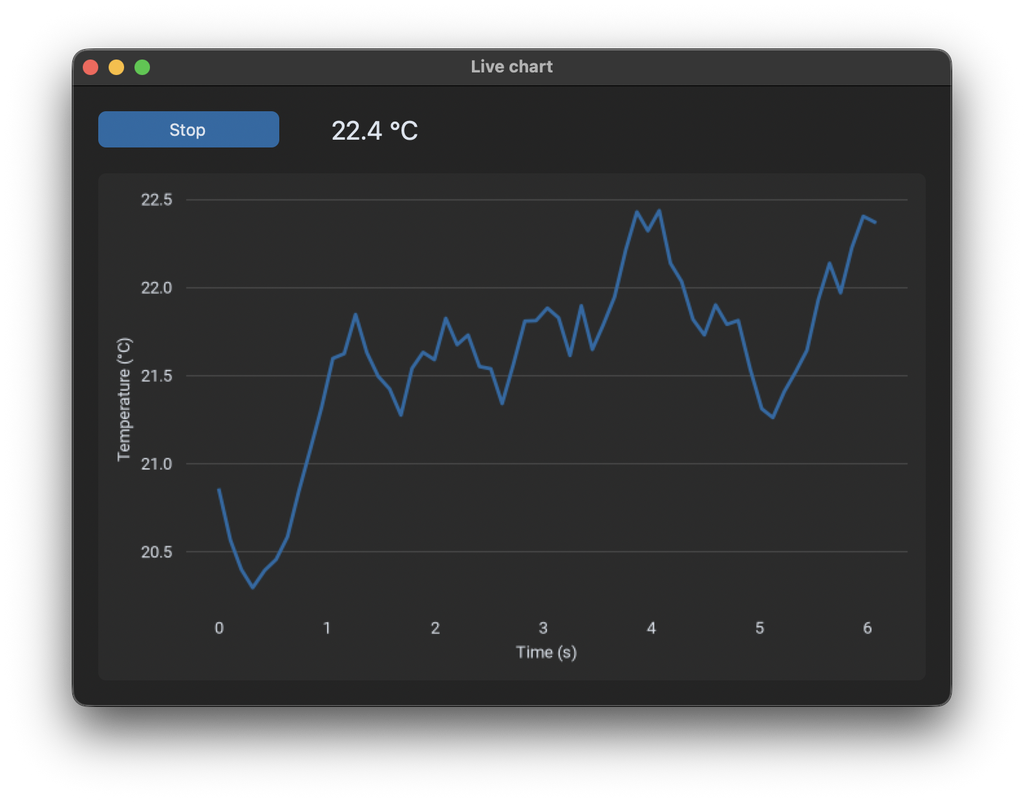
Data from a thread
Some apps show data that comes in all the time, for example from a sensor, a serial port or a network connection. Reading this data usually blocks until the next value arrives, so it runs in a thread, as explained in Long Tasks without Freezing. The thread never touches the chart or other widgets. It only puts the values into a queue.Queue:
def read_sensor(data_queue, stop_event):
    """Runs in a thread and creates a value every 100 ms, like a sensor or a serial port would."""
    start = time.time()
    value = 21.0
    while not stop_event.is_set():
        value += random.uniform(-0.3, 0.3)
        data_queue.put((time.time() - start, value))
        time.sleep(0.1)
In this example the values are random. In a real app, replace the content of the loop with the code that reads your data, for example serial_port.readline() from pyserial.
Only the newest values
If the chart shows all values since the start, it gets slower and slower and the newest values are hard to see. A deque with maxlen holds only the newest values and removes the oldest ones automatically:
MAX_POINTS = 100  # the chart shows only the newest values

self.times = deque(maxlen=MAX_POINTS)
self.values = deque(maxlen=MAX_POINTS)
Draw the chart regularly
The main thread checks the queue every 200 ms with after(). It takes all new values out of the queue, gives them to the line and draws the chart once:
    def update_chart(self):
        # take all new values from the queue
        new_values = False
        while not self.data_queue.empty():
            seconds, value = self.data_queue.get()
            self.times.append(seconds)
            self.values.append(value)
            new_values = True

        if new_values:
            self.line.set_data(self.times, self.values)
            self.ax.relim()  # recalculate the limits for the new data
            self.ax.autoscale_view()
            self.value_label.configure(text=f"{self.values[-1]:.1f} °C")
            self.canvas.draw_idle()

        if self.running:
            self.after(200, self.update_chart)
Drawing a matplotlib chart takes a few milliseconds. If the data comes in faster than that and the chart is drawn for every single value, the window gets slow. That's why we collect the values and draw only every 200 ms.
Matplotlib calculates the limits of the axes only when something is plotted. After set_data, relim() calculates them again from the new data and autoscale_view() applies them, so the chart moves with the data. If the y-axis should stay fixed, set it once with self.ax.set_ylim(...) instead.
Start and stop
The button starts and stops the thread. To stop it, the button sets a threading.Event, which the thread checks in every loop. When the thread is started again, it gets a new queue and a new event, so a value that the old thread puts into the queue at the last moment doesn't end up in the new chart:
    def toggle(self):
        if self.running:
            self.running = False
            self.stop_event.set()
            self.start_button.configure(text="Start")
        else:
            self.running = True
            self.data_queue = queue.Queue()  # a new queue and event for the new thread
            self.stop_event = threading.Event()
            ...
Look and closing the window
The chart has the colors and the font of CustomTkinter, like in Matplotlib in CustomTkinter. Because this chart has axis labels, their colors are set in apply_chart_colors too:
self.ax.xaxis.label.set_color(text_color)
self.ax.yaxis.label.set_color(text_color)
When the window is closed while the thread is running, destroy sets the event as well, so the thread ends together with the app:
    def destroy(self):
        self.stop_event.set()
        customtkinter.AppearanceModeTracker.remove(self.apply_chart_colors)
        super().destroy()
Full code
import os
import queue
import random
import threading
import time
from collections import deque
import customtkinter
import matplotlib
from matplotlib import font_manager
from matplotlib.figure import Figure
from matplotlib.backends.backend_tkagg import FigureCanvasTkAgg

customtkinter.set_appearance_mode("system")

# the chart uses the font that comes with CustomTkinter
FONT_FOLDER = os.path.join(os.path.dirname(customtkinter.__file__), "assets", "fonts", "Roboto")
font_manager.fontManager.addfont(os.path.join(FONT_FOLDER, "Roboto-Regular.ttf"))
matplotlib.rcParams["font.family"] = "Roboto"
matplotlib.rcParams["font.size"] = 13 * 72 / 100  # 13 pixels like the widgets, matplotlib uses points (1/72 inch)

MAX_POINTS = 100  # the chart shows only the newest values


def read_sensor(data_queue, stop_event):
    """Runs in a thread and creates a value every 100 ms, like a sensor or a serial port would."""
    start = time.time()
    value = 21.0
    while not stop_event.is_set():
        value += random.uniform(-0.3, 0.3)
        data_queue.put((time.time() - start, value))
        time.sleep(0.1)


class App(customtkinter.CTk):
    def __init__(self):
        super().__init__()

        self.title("Live chart")
        self.geometry("680x480")
        self.grid_columnconfigure(1, weight=1)
        self.grid_rowconfigure(1, weight=1)

        self.start_button = customtkinter.CTkButton(self, text="Start", command=self.toggle)
        self.start_button.grid(row=0, column=0, padx=20, pady=(20, 10))
        self.value_label = customtkinter.CTkLabel(self, text="", font=customtkinter.CTkFont(size=20))
        self.value_label.grid(row=0, column=1, padx=20, pady=(20, 10), sticky="w")

        self.chart_frame = customtkinter.CTkFrame(self)
        self.chart_frame.grid(row=1, column=0, columnspan=2, padx=20, pady=(10, 20), sticky="nsew")
        self.chart_frame.grid_columnconfigure(0, weight=1)
        self.chart_frame.grid_rowconfigure(0, weight=1)

        self.figure = Figure(figsize=(6, 3.5), dpi=100, layout="constrained")
        self.ax = self.figure.add_subplot()
        self.line, = self.ax.plot([], [], linewidth=2)
        self.ax.set_xlabel("Time (s)")
        self.ax.set_ylabel("Temperature (°C)")

        # flat look like the widgets: no frame around the plot and no tick marks, only grid lines
        for spine in self.ax.spines.values():
            spine.set_visible(False)
        self.ax.tick_params(length=0, pad=8)

        self.canvas = FigureCanvasTkAgg(self.figure, master=self.chart_frame)
        self.canvas.get_tk_widget().grid(row=0, column=0, padx=10, pady=10, sticky="nsew")

        self.times = deque(maxlen=MAX_POINTS)
        self.values = deque(maxlen=MAX_POINTS)
        self.data_queue = queue.Queue()
        self.stop_event = threading.Event()
        self.running = False

        self.apply_chart_colors()
        customtkinter.AppearanceModeTracker.add(self.apply_chart_colors)

    def toggle(self):
        if self.running:
            self.running = False
            self.stop_event.set()
            self.start_button.configure(text="Start")
        else:
            self.running = True
            self.data_queue = queue.Queue()  # a new queue and event for the new thread
            self.stop_event = threading.Event()
            self.times.clear()
            self.values.clear()
            thread = threading.Thread(target=read_sensor, args=(self.data_queue, self.stop_event), daemon=True)
            thread.start()
            self.start_button.configure(text="Stop")
            self.update_chart()

    def update_chart(self):
        # take all new values from the queue
        new_values = False
        while not self.data_queue.empty():
            seconds, value = self.data_queue.get()
            self.times.append(seconds)
            self.values.append(value)
            new_values = True

        if new_values:
            self.line.set_data(self.times, self.values)
            self.ax.relim()  # recalculate the limits for the new data
            self.ax.autoscale_view()
            self.value_label.configure(text=f"{self.values[-1]:.1f} °C")
            self.canvas.draw_idle()

        if self.running:
            self.after(200, self.update_chart)

    def to_hex(self, color):
        # matplotlib doesn't know tkinter color names like "gray86", so we convert them to hex
        red, green, blue = self.winfo_rgb(color)
        return f"#{red // 256:02x}{green // 256:02x}{blue // 256:02x}"

    def apply_chart_colors(self, mode=None):
        # colors of the current theme, index 0 is light mode, 1 is dark mode
        theme = customtkinter.ThemeManager.theme
        i = 0 if customtkinter.get_appearance_mode() == "Light" else 1
        background = self.to_hex(theme["CTkFrame"]["fg_color"][i])
        text_color = self.to_hex(theme["CTkLabel"]["text_color"][i])
        line_color = self.to_hex(theme["CTkButton"]["fg_color"][i])
        grid_color = self.to_hex(theme["CTkFrame"]["border_color"][i])

        self.figure.set_facecolor(background)
        self.ax.set_facecolor(background)
        self.line.set_color(line_color)
        self.ax.xaxis.label.set_color(text_color)
        self.ax.yaxis.label.set_color(text_color)
        self.ax.tick_params(colors=text_color)
        self.ax.grid(True, axis="y", color=grid_color, linewidth=0.8)  # only horizontal lines

        self.canvas.get_tk_widget().configure(bg=background)
        self.canvas.draw_idle()

    def destroy(self):
        self.stop_event.set()
        customtkinter.AppearanceModeTracker.remove(self.apply_chart_colors)
        super().destroy()


app = App()
app.mainloop()
Common errors
The line leaves the chart
The limits of the axes are not updated after set_data. Call self.ax.relim() and self.ax.autoscale_view() before drawing, or set fixed limits with set_xlim and set_ylim.
The window gets slower over time
The chart has too many points, or a new line is plotted on every update instead of changing the data of the existing one. Keep only the newest values, for example with a deque like above, and use set_data on the existing line. Calling self.ax.clear() and plotting everything again also works, but it's slower.
RuntimeError: main thread is not in main loop
The thread changed the chart or a widget. Only put the data into the queue in the thread, and update the chart in the main thread like above.