2. Zoom, Pan and Mouse Events
The toolbar of matplotlib
Matplotlib has a toolbar with buttons to move and zoom the chart, which is created with NavigationToolbar2Tk. But the toolbar is a tkinter frame with tkinter buttons and its own icons, so it looks different than the rest of the app and doesn't change with the appearance mode.
Instead of showing the toolbar, we create it without placing it in the window and call its functions from CustomTkinter widgets. With pack_toolbar=False the toolbar doesn't place itself:
# the toolbar of matplotlib is not placed in the window, the buttons above use its functions
self.toolbar = NavigationToolbar2Tk(self.canvas, self.chart_frame, pack_toolbar=False)
The chart in this tutorial has the colors and the font of CustomTkinter, like in Matplotlib in CustomTkinter.
Move and zoom
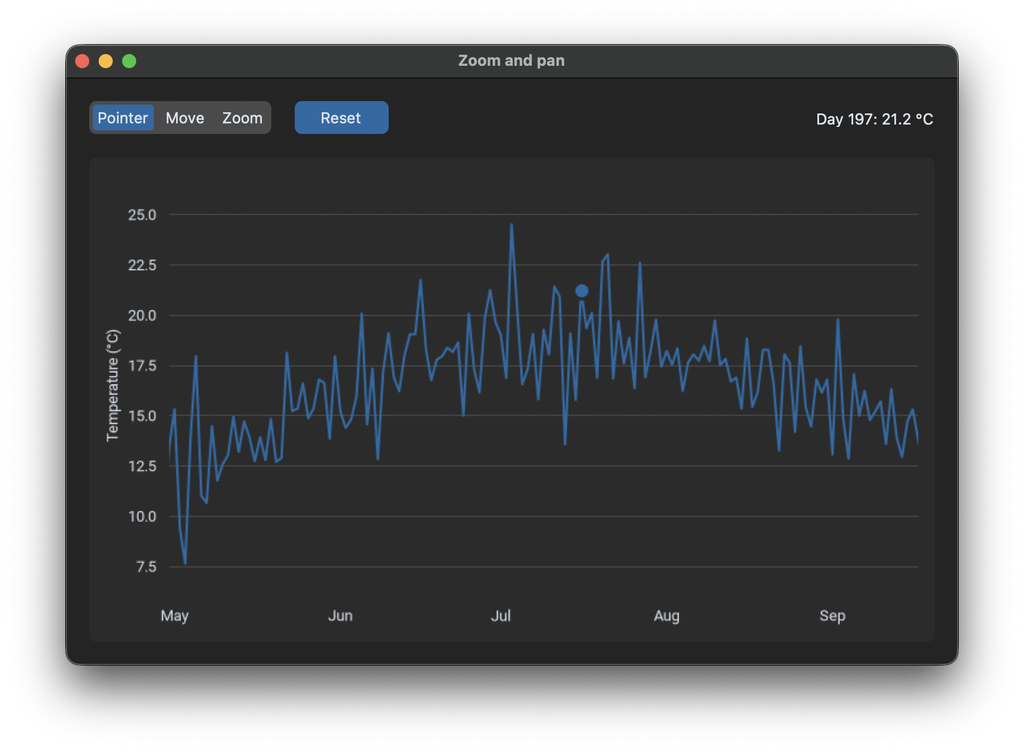
A CTkSegmentedButton switches between three modes. In the mode "Move", the chart moves when you drag it with the left mouse button, and with the right mouse button it zooms. In the mode "Zoom", you drag a rectangle with the left mouse button, which is then zoomed in. "Pointer" turns both off.
pan() and zoom() of the toolbar turn their mode on, or off if it's already on. So we first turn off the old mode and then turn on the new one:
    def change_mode(self, mode):
        # pan() and zoom() turn their mode on, or off if it is already on
        if self.mode == "Move":
            self.toolbar.pan()
        elif self.mode == "Zoom":
            self.toolbar.zoom()

        if mode == "Move":
            self.toolbar.pan()
        elif mode == "Zoom":
            self.toolbar.zoom()
        self.mode = mode
The toolbar remembers the views. home() goes back to the first view, which is what the reset button does:
    def reset_view(self):
        self.toolbar.home()
back() and forward() go to the previous and the next view, like the arrow buttons of the toolbar. If you put new data into the chart, call self.toolbar.update(), otherwise home() goes back to the view of the old data.
Mouse events
With mpl_connect a function is called for events on the chart, similar to bind for widgets. The most important events are "button_press_event", "button_release_event", "motion_notify_event" (the mouse moved), "scroll_event" and "axes_leave_event" (the mouse left the plot). We use them to show the value under the mouse:
self.canvas.mpl_connect("motion_notify_event", self.mouse_moved)
self.canvas.mpl_connect("axes_leave_event", self.mouse_left)
The function gets an event object. event.inaxes is the axes under the mouse, or None if the mouse is outside of the plot. event.xdata and event.ydata are the position of the mouse in the coordinates of the data, here the day and the temperature. We look for the day closest to the mouse and show its value in a label and with a point on the line:
    def mouse_moved(self, event):
        if event.inaxes != self.ax:
            return
        index = np.abs(DAYS - event.xdata).argmin()  # the day closest to the mouse
        self.show_value(index)

    def show_value(self, index):
        self.point.set_data([DAYS[index]], [TEMPERATURES[index]])
        self.value_label.configure(text=f"Day {DAYS[index]}: {TEMPERATURES[index]:.1f} °C")
        self.canvas.draw_idle()
The point is a second line with only one value and a marker, which is created empty at the start:
self.point, = self.ax.plot([], [], marker="o", markersize=10, markeredgewidth=2) # value under the mouse
In apply_chart_colors it gets the color of the line and an edge in the background color, which makes it look like the button of a CTkSlider:
self.point.set_markerfacecolor(line_color)
self.point.set_markeredgecolor(background)  # a ring in the background color, like the slider button
Full code
import os
import numpy as np
import customtkinter
import matplotlib
from matplotlib import font_manager
from matplotlib.figure import Figure
from matplotlib.backends.backend_tkagg import FigureCanvasTkAgg, NavigationToolbar2Tk

customtkinter.set_appearance_mode("system")

# the chart uses the font that comes with CustomTkinter
FONT_FOLDER = os.path.join(os.path.dirname(customtkinter.__file__), "assets", "fonts", "Roboto")
font_manager.fontManager.addfont(os.path.join(FONT_FOLDER, "Roboto-Regular.ttf"))
matplotlib.rcParams["font.family"] = "Roboto"
matplotlib.rcParams["font.size"] = 13 * 72 / 100  # 13 pixels like the widgets, matplotlib uses points (1/72 inch)

# example data: a temperature for every day of a year
DAYS = np.arange(1, 366)
TEMPERATURES = 10 - 9 * np.cos(2 * np.pi * (DAYS - 15) / 365) + np.random.default_rng(1).normal(0, 2, DAYS.size)
MONTH_STARTS = [1, 32, 60, 91, 121, 152, 182, 213, 244, 274, 305, 335]
MONTHS = ["Jan", "Feb", "Mar", "Apr", "May", "Jun", "Jul", "Aug", "Sep", "Oct", "Nov", "Dec"]


class App(customtkinter.CTk):
    def __init__(self):
        super().__init__()

        self.title("Zoom and pan")
        self.geometry("760x500")
        self.grid_columnconfigure(2, weight=1)
        self.grid_rowconfigure(1, weight=1)

        self.mode_button = customtkinter.CTkSegmentedButton(self, values=["Pointer", "Move", "Zoom"],
                                                            command=self.change_mode)
        self.mode_button.grid(row=0, column=0, padx=(20, 10), pady=(20, 10))
        self.mode_button.set("Pointer")
        self.mode = "Pointer"

        self.reset_button = customtkinter.CTkButton(self, text="Reset", width=80, command=self.reset_view)
        self.reset_button.grid(row=0, column=1, padx=10, pady=(20, 10))

        self.value_label = customtkinter.CTkLabel(self, text="")
        self.value_label.grid(row=0, column=2, padx=(10, 20), pady=(20, 10), sticky="e")

        self.chart_frame = customtkinter.CTkFrame(self)
        self.chart_frame.grid(row=1, column=0, columnspan=3, padx=20, pady=(10, 20), sticky="nsew")
        self.chart_frame.grid_columnconfigure(0, weight=1)
        self.chart_frame.grid_rowconfigure(0, weight=1)

        self.figure = Figure(figsize=(6, 3.5), dpi=100, layout="constrained")
        self.ax = self.figure.add_subplot()
        self.line, = self.ax.plot(DAYS, TEMPERATURES, linewidth=1.5)
        self.point, = self.ax.plot([], [], marker="o", markersize=10, markeredgewidth=2)  # value under the mouse
        self.ax.set_xticks(MONTH_STARTS, MONTHS)
        self.ax.set_ylabel("Temperature (°C)")

        # flat look like the widgets: no frame around the plot and no tick marks, only grid lines
        for spine in self.ax.spines.values():
            spine.set_visible(False)
        self.ax.tick_params(length=0, pad=8)

        self.canvas = FigureCanvasTkAgg(self.figure, master=self.chart_frame)
        self.canvas.get_tk_widget().grid(row=0, column=0, padx=10, pady=10, sticky="nsew")

        # the toolbar of matplotlib is not placed in the window, the buttons above use its functions
        self.toolbar = NavigationToolbar2Tk(self.canvas, self.chart_frame, pack_toolbar=False)

        self.canvas.mpl_connect("motion_notify_event", self.mouse_moved)
        self.canvas.mpl_connect("axes_leave_event", self.mouse_left)

        self.apply_chart_colors()
        customtkinter.AppearanceModeTracker.add(self.apply_chart_colors)

    def change_mode(self, mode):
        # pan() and zoom() turn their mode on, or off if it is already on
        if self.mode == "Move":
            self.toolbar.pan()
        elif self.mode == "Zoom":
            self.toolbar.zoom()

        if mode == "Move":
            self.toolbar.pan()
        elif mode == "Zoom":
            self.toolbar.zoom()
        self.mode = mode

    def reset_view(self):
        self.toolbar.home()

    def mouse_moved(self, event):
        if event.inaxes != self.ax:
            return
        index = np.abs(DAYS - event.xdata).argmin()  # the day closest to the mouse
        self.show_value(index)

    def show_value(self, index):
        self.point.set_data([DAYS[index]], [TEMPERATURES[index]])
        self.value_label.configure(text=f"Day {DAYS[index]}: {TEMPERATURES[index]:.1f} °C")
        self.canvas.draw_idle()

    def mouse_left(self, event):
        self.point.set_data([], [])
        self.value_label.configure(text="")
        self.canvas.draw_idle()

    def to_hex(self, color):
        # matplotlib doesn't know tkinter color names like "gray86", so we convert them to hex
        red, green, blue = self.winfo_rgb(color)
        return f"#{red // 256:02x}{green // 256:02x}{blue // 256:02x}"

    def apply_chart_colors(self, mode=None):
        # colors of the current theme, index 0 is light mode, 1 is dark mode
        theme = customtkinter.ThemeManager.theme
        i = 0 if customtkinter.get_appearance_mode() == "Light" else 1
        background = self.to_hex(theme["CTkFrame"]["fg_color"][i])
        text_color = self.to_hex(theme["CTkLabel"]["text_color"][i])
        line_color = self.to_hex(theme["CTkButton"]["fg_color"][i])
        grid_color = self.to_hex(theme["CTkFrame"]["border_color"][i])

        self.figure.set_facecolor(background)
        self.ax.set_facecolor(background)
        self.line.set_color(line_color)
        self.point.set_markerfacecolor(line_color)
        self.point.set_markeredgecolor(background)  # a ring in the background color, like the slider button
        self.ax.yaxis.label.set_color(text_color)
        self.ax.tick_params(colors=text_color)
        self.ax.grid(True, axis="y", color=grid_color, linewidth=0.8)  # only horizontal lines

        self.canvas.get_tk_widget().configure(bg=background)
        self.canvas.draw_idle()

    def destroy(self):
        customtkinter.AppearanceModeTracker.remove(self.apply_chart_colors)
        super().destroy()


app = App()
app.mainloop()
Common errors
TclError: cannot use geometry manager pack inside ... which already has slaves managed by grid
The toolbar packs itself into its master by default, also when it's not needed. Pass pack_toolbar=False to NavigationToolbar2Tk.
TypeError: unsupported operand type(s) for -: 'int' and 'NoneType'
event.xdata is None when the mouse is not over the plot. Check event.inaxes first, like in mouse_moved above.
The reset button shows the old data
The toolbar still has the views of the old data. Call self.toolbar.update() after you changed the data.